
The workspace is where you browse the graph yourself: which services call which, through which methods, and how protobuf fields flow between them, down to the code. Each chat has a workspace of its own, which the assistant can also open views in.
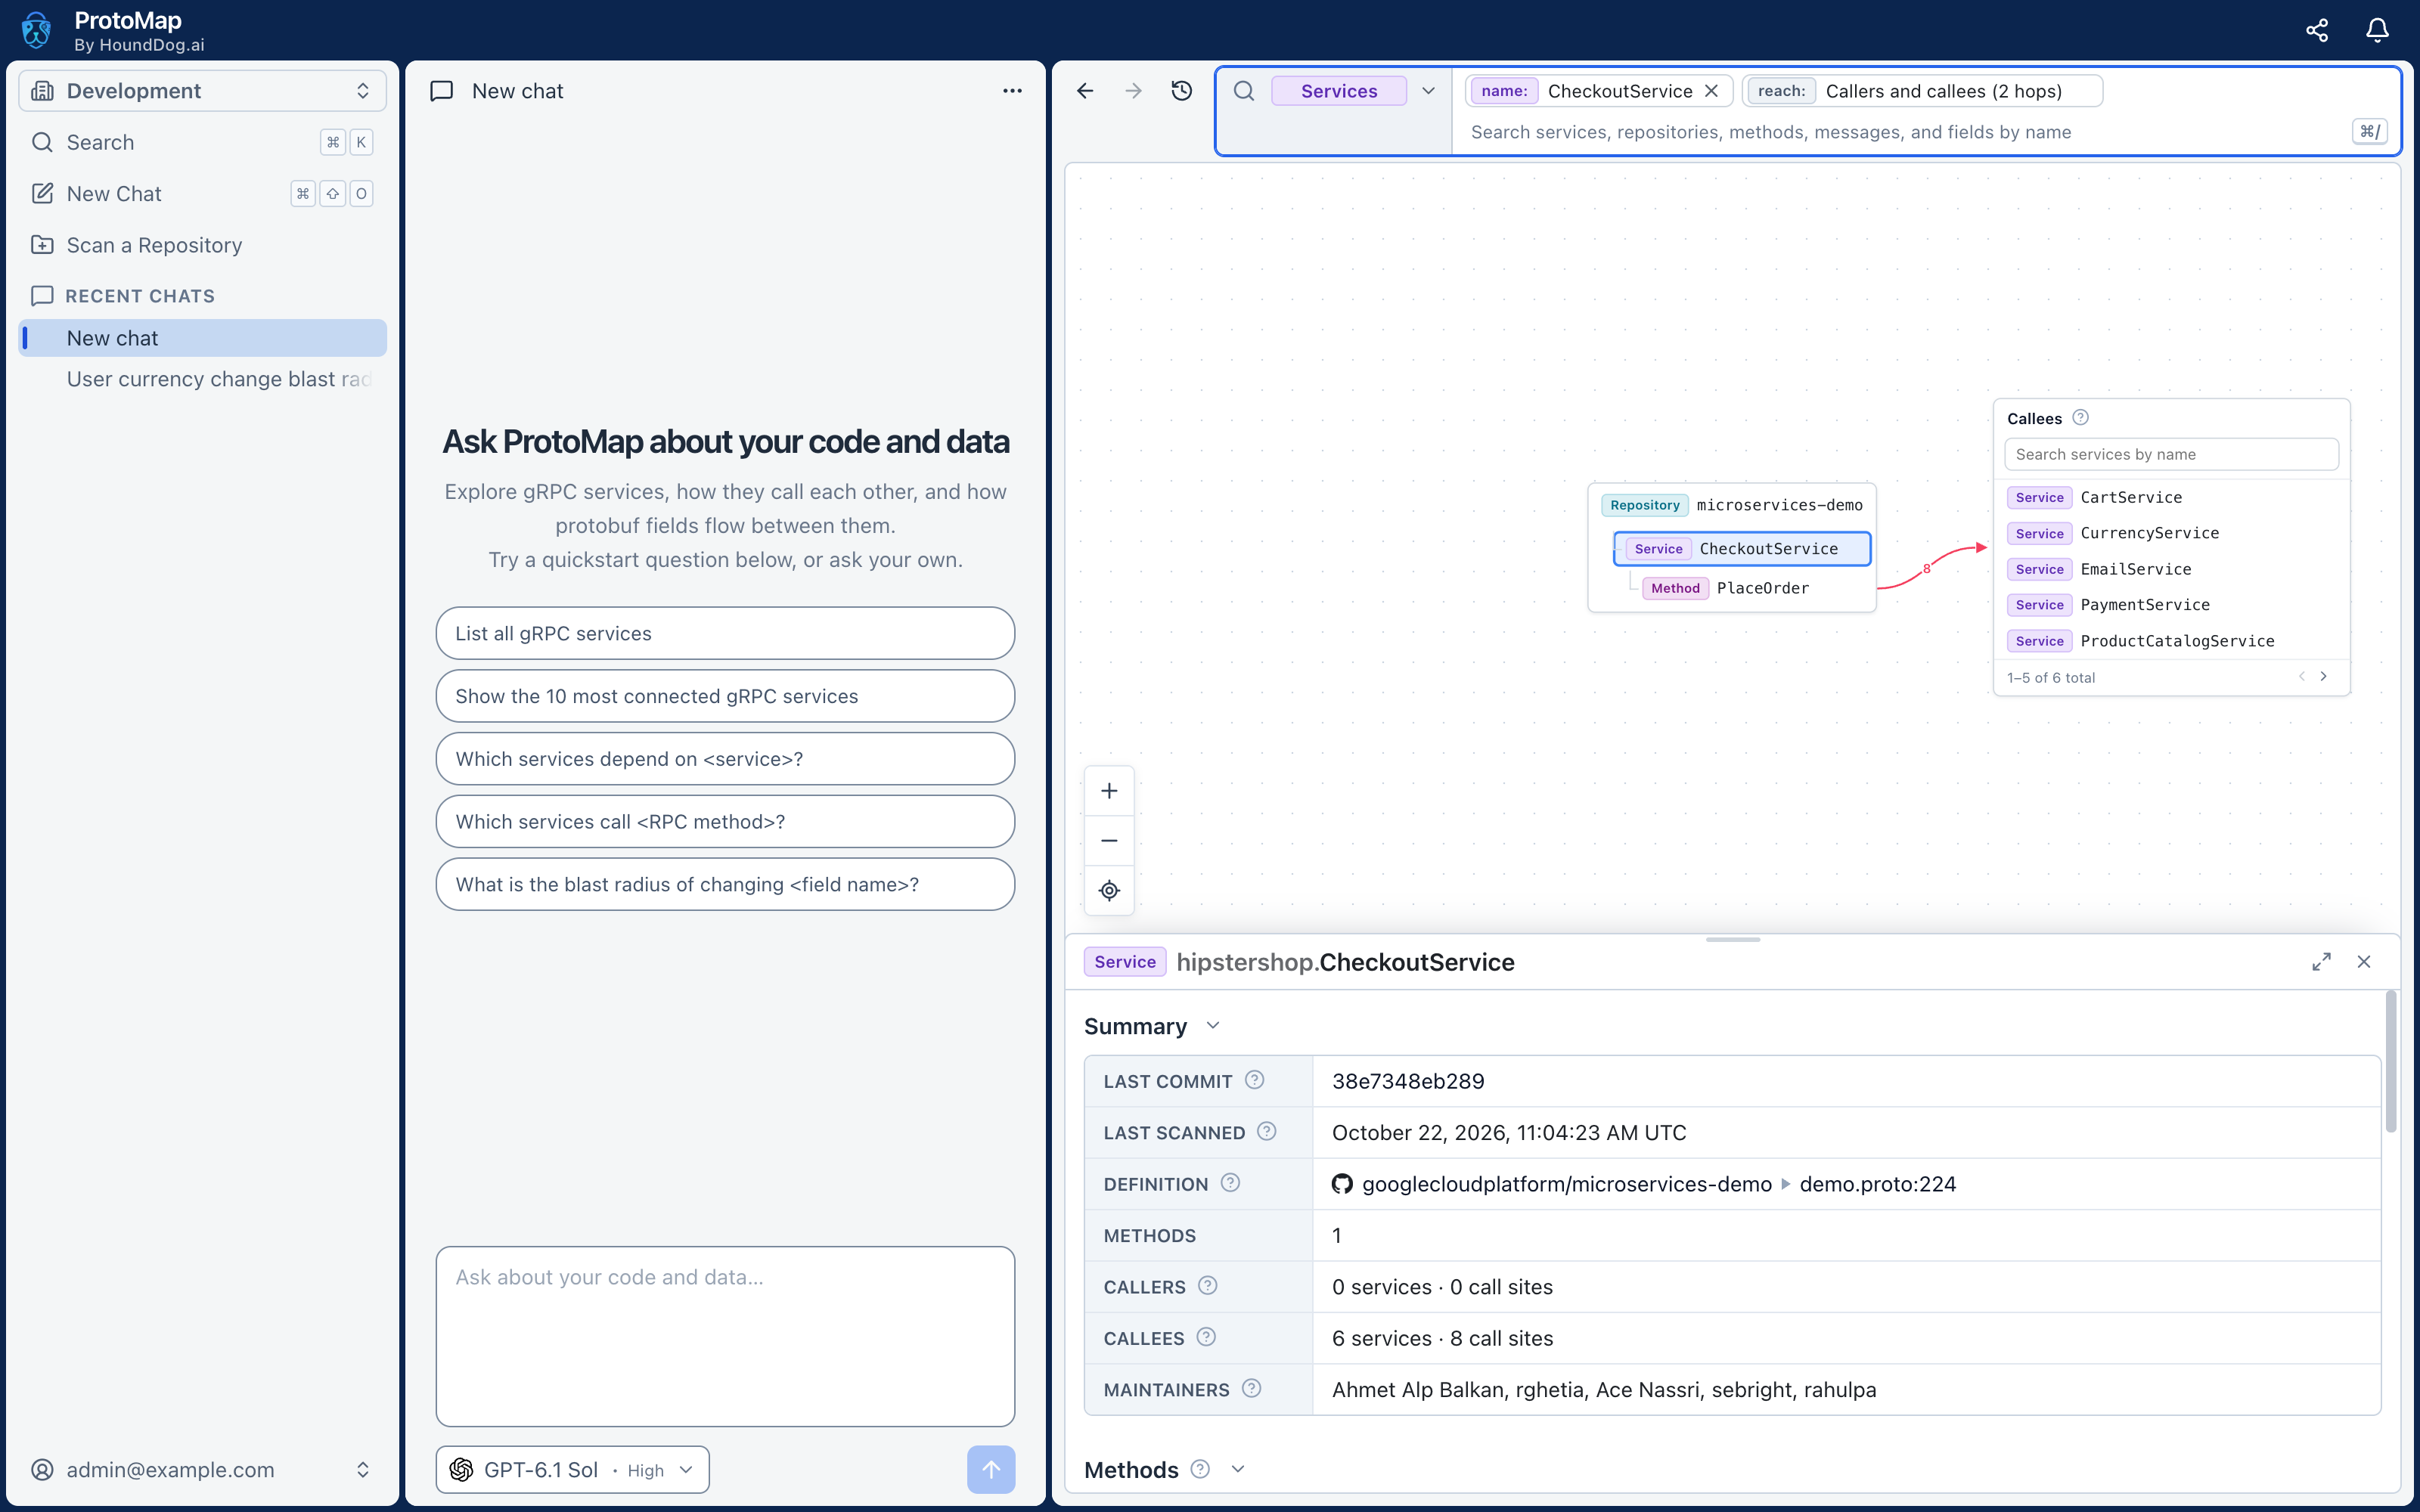
The view selector at the start of the search bar picks what the view lists: Repositories, Services, Methods, Messages, or Fields. Services is the default.
ProtoMap picks the layout that suits what you are looking at:
- Sphere — an overview of many items as a rotating sphere of dots. The bigger the dot, the more connected the item. Hover over one to light up what reaches it (blue) and what it reaches (red).
- Table — large sets of methods, messages, or fields.
- Columns — a few selected items as cards joined by edges, such as a method between the request and response messages it exchanges. Click an edge to see the calls or fields it carries. You can drag and resize the cards.
Double-click an item to drill down into it: from a repository to its services, to their methods, to their messages, to their fields.
The Go back and Go forward arrows move through the views you opened, and View history lists them all.
Search
Section titled “Search”Press ⌘ / (Ctrl / on Windows and Linux) or click the search bar to find
services, repositories, methods, messages, and fields by name. Results are grouped by kind. Picking one adds it to the
view as a name: filter; you can add several to compare them.
To search one kind, start with its name, such as service:, method:, message:, or field:. Other filters narrow
the view by ownership and use, such as owned-by-repo: and used-by-repo:.
When the view holds a single item, a reach: filter shows what it connects to: its Callers and Callees for a
service or method, or its Dependents and Dependencies otherwise. Choose the direction and how many hops away to
look, from 1 to 5.
This answers questions such as what would break if I changed this method? — the callers within a few hops are its blast radius.
Detail Sheet
Section titled “Detail Sheet”The detail sheet across the bottom of the view lists the view’s items, or details the item, edge, or code you selected. Drag its top edge to resize it, or maximize it to fill the view.
| Item | What the sheet shows |
|---|---|
| Repository | Its last commit and scan, primary branch, languages, services, dependents, dependencies, and scan history. |
| Service | Its definition, methods, callers, callees, and the people who maintain it. |
| Method | Its callers, every call site, its callees, its handlers, and its request and response fields. |
| Its fields, which methods send and receive it, and which messages contain it. | |
| Field | Where it is sent from and where it is received. |
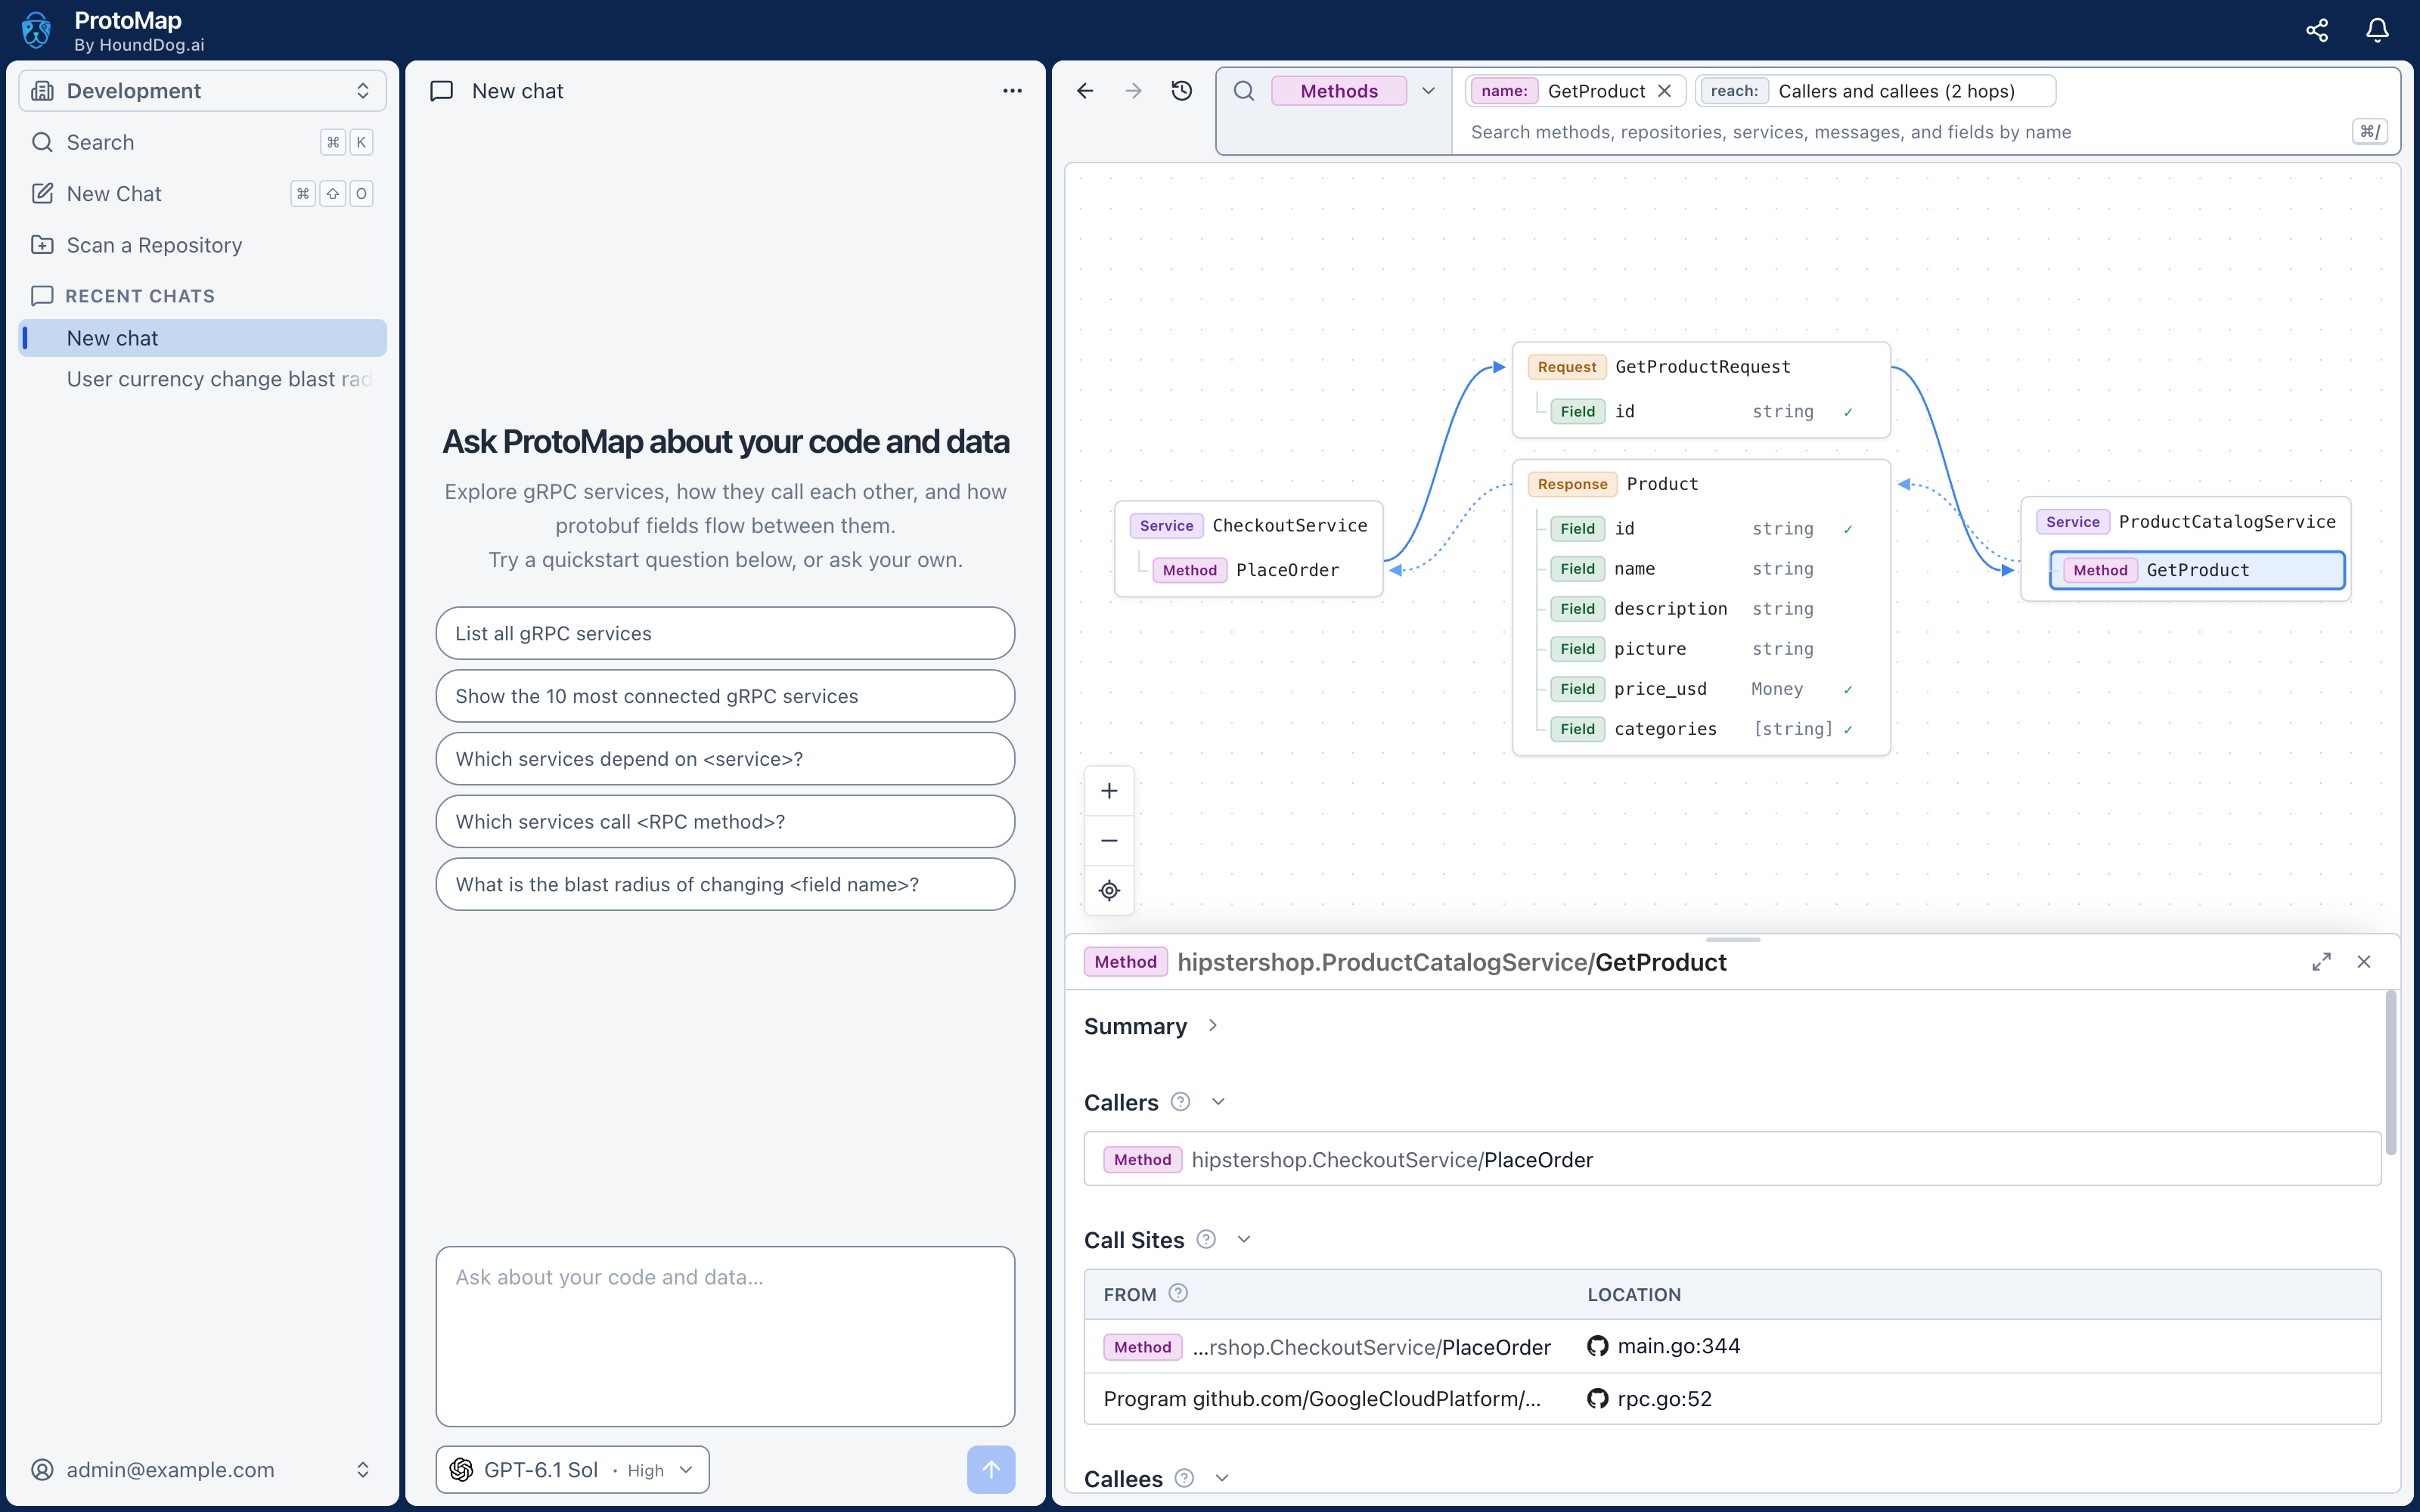
Click a location, such as a call site’s main.go:344, to open its code in the sheet, with the branch and commit it
came from. For a protobuf definition, the sheet also lists the copies of the same file in other repositories. Locations
also link to the repository on its Git host when ProtoMap recognizes it, such as GitHub, GitLab, Bitbucket, or Azure
DevOps.
A flow follows a protobuf field through the code, step by step, from where a service receives it to where it sends it on, and into the next service. Open one from a field’s details or from the assistant’s answers. Its page shows:
- Summary — the source and target fields, the repository, and the evidence:
- Every step is certain, or A step is uncertain when ProtoMap could not tell for sure, such as a call whose method name is built from a string.
- The AI review, when one has run: how likely the flow is to be real.
- Code Evidence — each step, with its code.
- Continues Into — the flows it leads to in other services.
Click Ask About This Flow to discuss it with the assistant.
Diagrams
Section titled “Diagrams”The assistant can draw diagrams, such as a sequence of calls across services. A diagram opens in the workspace, and clicking one of its nodes opens that item. Zoom, fit it to the view, or switch between top-down and left-to-right layouts with the controls beside it.
Your Changes
Section titled “Your Changes”The workspace shows the graph everyone in your organization shares, with your own private scans laid over it, such as scans of uncommitted changes or other branches. Nobody else sees those.